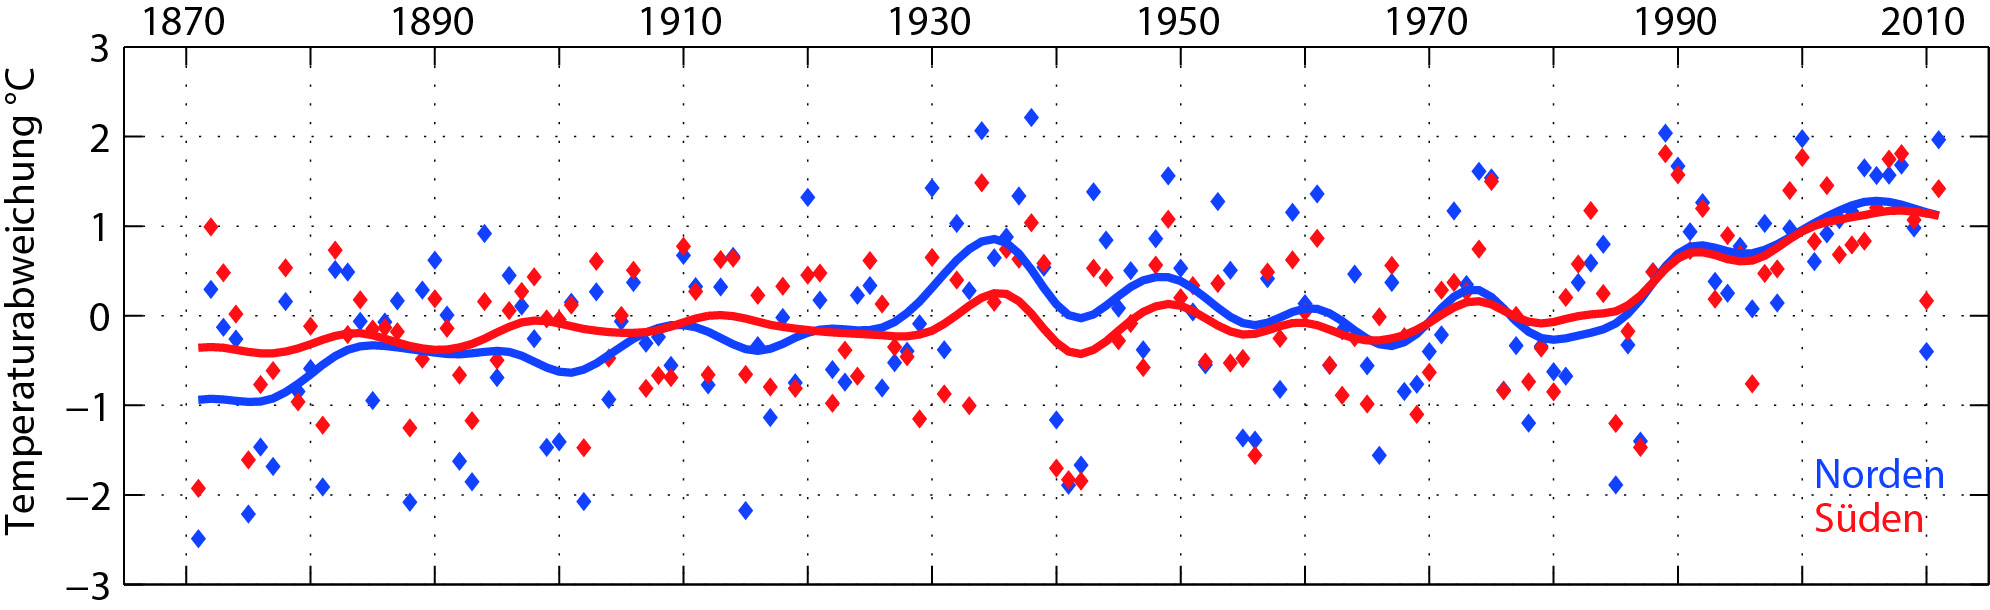
Grafik
Jährliche Lufttemperaturabweichungen vom langjährigen Mittelwert (1960-1991) in der Ostseeregion im Zeitraum 1871-2011 (Norden bzw Süden bezieht sich auf die Bereiche nördlich bzw südlich 60° Nord, also etwa der Linie Stockholm - St. Petersburg)
Graph
Annual mean surface air temperatures (relative to 1960-1991) for the Baltic Sea basin 1871-2011 (North = north of 60° N, South = south of 60° N, which approximates the line Stockholm - St. Petersburg)
