Article from Baltic Earth Newsletter 3 (June 2017):
Seasonal variability of the Baltic Sea sea level based on satellite altimetry
O.U. Nizhnikovskaya1,2 and S.A. Lebedev3,4,5
1Immanuel Kant Baltic Federal University, 14, str. A. Nevskogo, Kaliningrad, Russia, 236041; E-mail: olga0g@yandex.ru
2P.P. Shirshov Institute of Oceanology of the Russian Academy of Sciences, 36, Nakhimovski prospect, Moscow, Russia, 117997
3Geophysical Center of the Russian Academy of Sciences, 3, Molodezhnaya str., Moscow, Russia, 119296; E-mail: lebedev@wdcb.ru
4Space Research Institute of the Russian Academy of Sciences, 84/32 Profsoyuznaya str., Moscow, Russia, 117342; E-mail: sergey_a_lebedev@mail.ru
5Maykop State Technological University, 191 Pervomayskaya str., Maykop, Republic of Adygea, Russia, 385000
Satellite altimetry is extremely important for a comprehensive investigation of Baltic Sea sea level variability. It is one of the active remote sensing methods with the main advantage of sensing in the microwave range, associated with the high penetrating capability of radio waves through the atmosphere. Measurements may be conducted at any time of the day, in virtually all weather conditions, also in the presence of high concentrations of aerosols. Another important advantage of satellite altimetry data is their binding to the center of mass of the earth-moon system. This means that contemporary vertical crustal movements have no effect on altimetric measurements onboard the satellite.
Altimetry data of the satellites TOPEX/Poseidon and Jason-1/2 were verified by hourly SHMI (Swedish Meteorological and Hydrological Institute) tide gauge data and monthly data from the PSMSL (Permanent Service for Mean Sea Level) system. The results of the comparative analysis of remote sensing data and tide gauge measurements have shown a correlation coefficient in the range of 0.889–0.969.
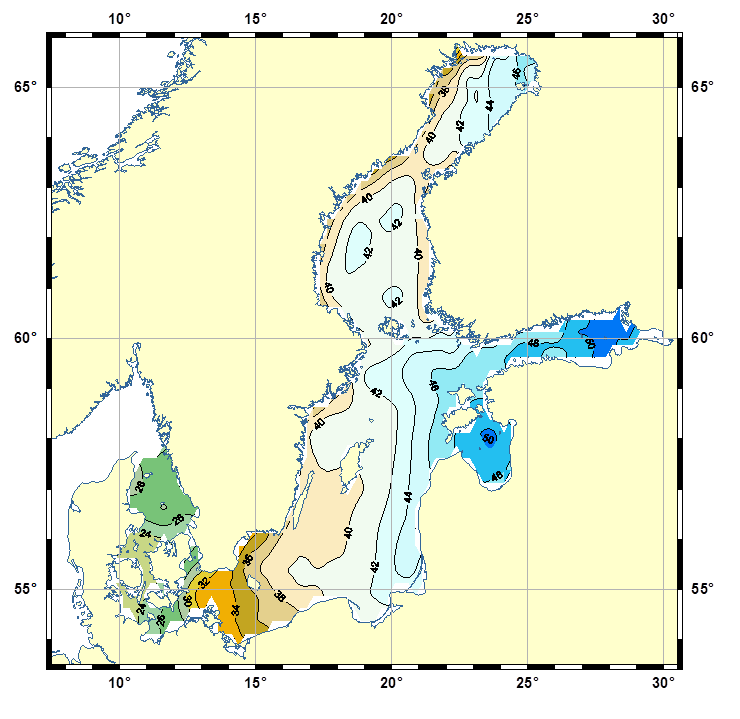
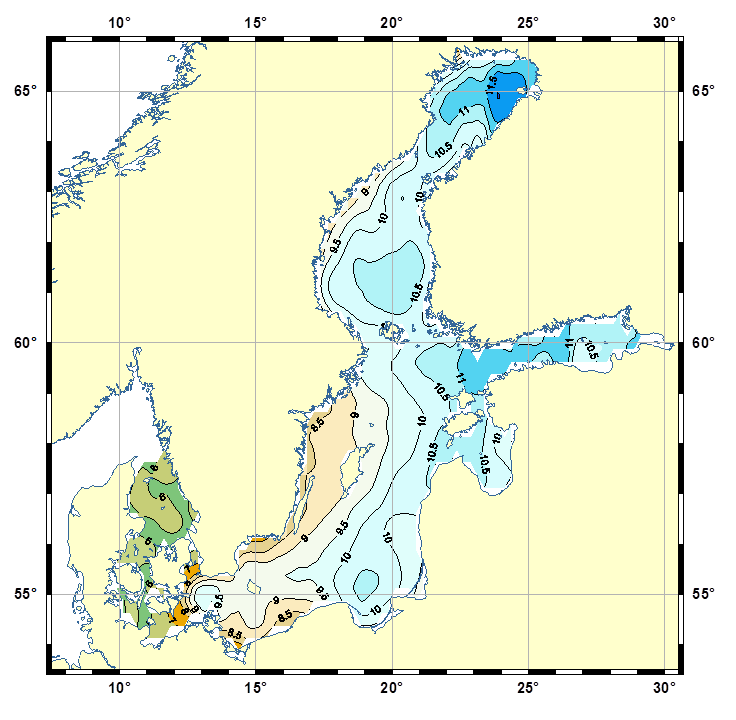
Seasonal variability of sea level was analyzed as temporal anomalies at fixed points on the track and in the crossover points of ascending and descending tracks. Maps of the mean seasonal level amplitude and its standard deviations are shown in Figure 1.
The maximum mean seasonal amplitude levels (> 50 cm) are observed in the Gulf of Finland and the Gulf of Riga, which receive the flows from the Neva (runoff 83,5 km3 per year) and Daugava rivers (runoff of 19.7 km3 per year). The smallest values (< 30 cm) are observed in the Kattegat and the Danish straits. Standard deviations of the seasonal cycle of the sea level amplitude are observed in the Gulf of Finland and the Gulf of Bothnia (> 11 cm), with minimum values (< 8 cm) observed also in the Kattegat and the Danish straits. |